What Are America's National Parks Worth?
The federal cost of maintaining the National Park System, the economy it supports, and what the numbers reveal about its financial value.
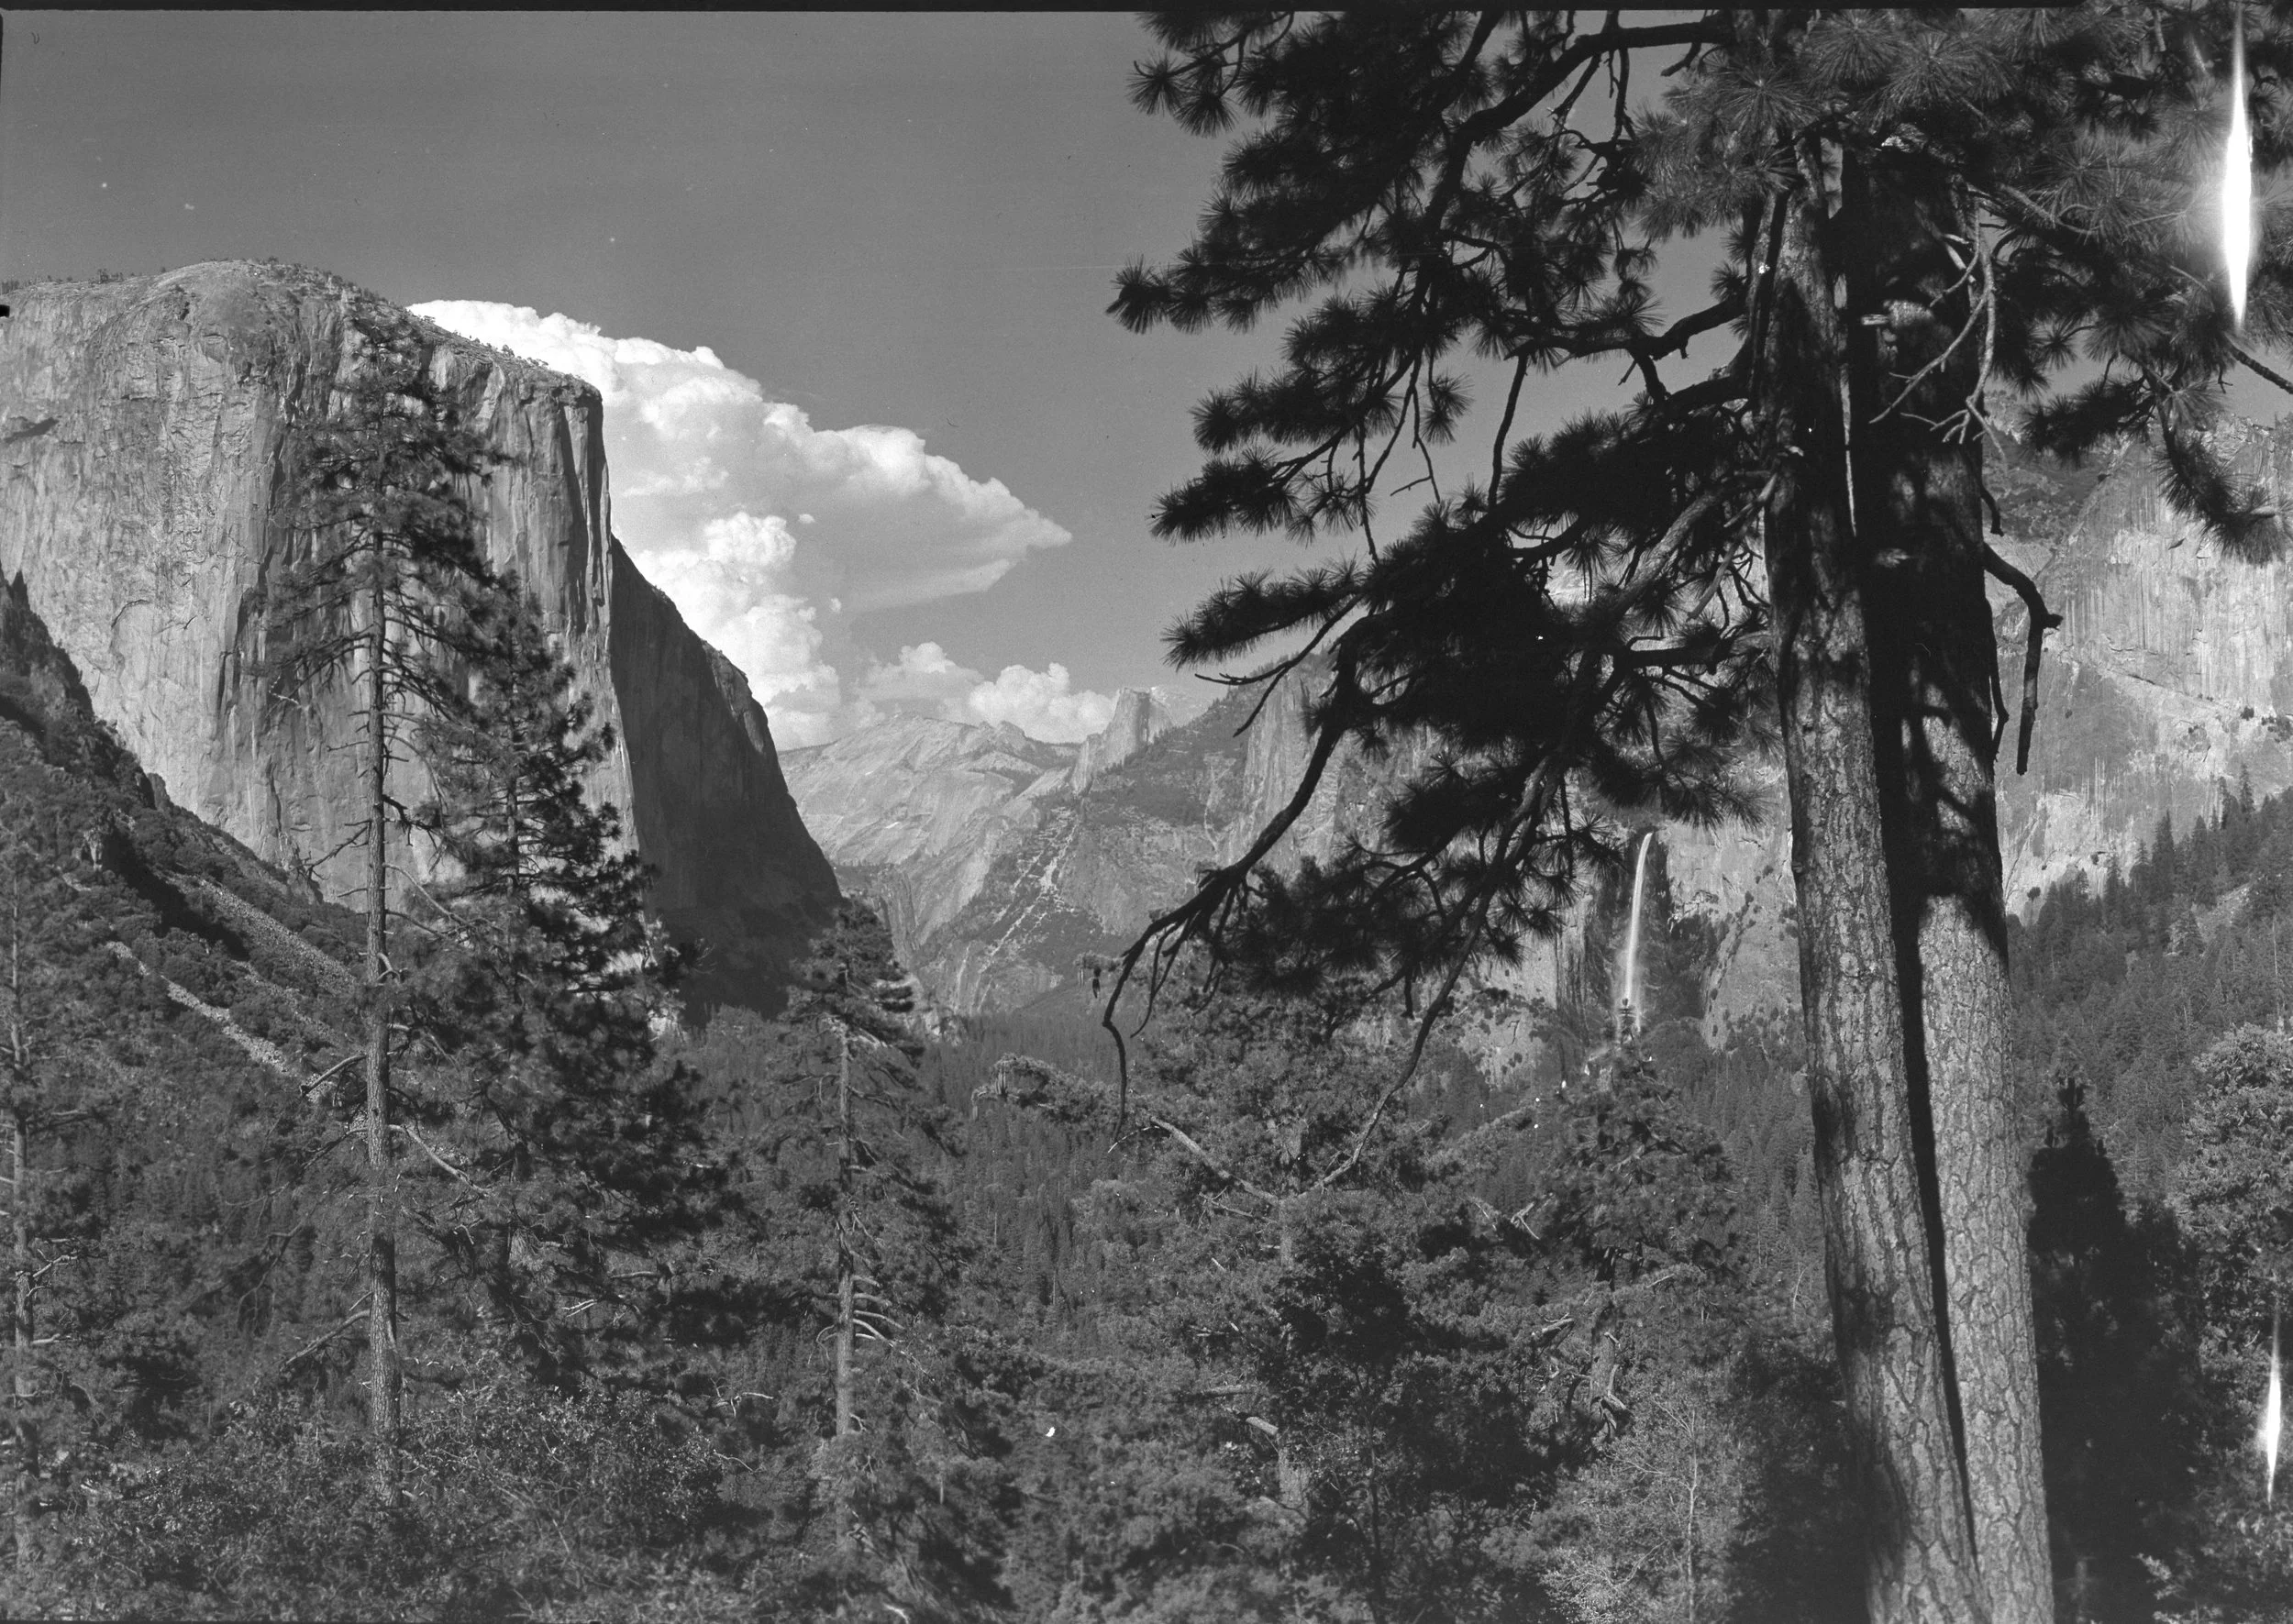
Yosemite Valley from Wawona Road, 1940. Photograph by Ralph H. Anderson / National Park Service.
Full disclosure: We believe America's national parks are priceless.
Trying to assign them a monetary value runs counter to the very idea behind their creation. These are places we've chosen to protect and set aside for the enjoyment of everyone, including generations who haven't been born yet. Their worth was never supposed to depend on how much money they generate.
But with federal spending and the future of our public lands under scrutiny, we became curious about what the numbers might tell us.
What if we set aside, for a moment, everything we believe makes these places worth protecting and considered them strictly from a financial perspective? Could the expense of maintaining the National Park System be justified by the economic activity it supports and the revenue it generates?
In 2024, Congress provided approximately $3.3 billion in regular funding to the National Park Service. Visitors spent an estimated $29 billion in communities surrounding NPS destinations that year, with that spending contributing to $33.7 billion in economic value added across the country. The federal government also collects taxes from the businesses and workers participating in that economy, although the NPS doesn't calculate how much those taxes amount to.
Whether that tax revenue is enough to cover the federal cost of the parks is difficult to determine. But the available research gives us a much clearer picture of the economy that has developed around them.
The Federal Cost
The National Park Service received $3.325 billion in regular congressional appropriations for fiscal year 2024, according to the Congressional Research Service. Approximately $2.888 billion was designated for park operations, with the remainder supporting construction, historic preservation, and other agency programs.
The National Park System encompassed 433 units in 2024. Along with the familiar national parks, the agency manages historic sites, monuments, battlefields, and recreation areas. Maintaining those places requires road repairs and wastewater treatment, archaeological preservation, emergency services, and work that visitors rarely see.
Congressional appropriations are only part of the NPS budget. The agency also receives money through dedicated revenue accounts and other federal programs, including funding for infrastructure projects extending across multiple years.
At the end of fiscal year 2024, the NPS reported approximately $22.99 billion in deferred maintenance and repairs. Much of the backlog involves roads, bridges, buildings, and utility systems that have passed their scheduled maintenance or replacement dates. Some projects become more expensive the longer repairs are postponed.
For communities that depend on park tourism, the condition of those roads and facilities can have consequences well beyond park boundaries.
What Visitors Contribute
The NPS collects money through entrance and recreation fees, along with payments from concession businesses operating inside the parks. Federal budget records show approximately $378 million in recreation-enhancement receipts and $181 million in concession franchise fees during fiscal year 2024.
Together, those receipts amounted to $559 million, equivalent to about 17% of regular congressional appropriations.
Much of the recreation-fee revenue stays within the park system. Federal law generally directs at least 80% of applicable fees back to the collecting site, where the money can be used for maintenance and visitor improvements. Because these receipts flow through dedicated funding accounts, subtracting them directly from congressional appropriations wouldn't provide an accurate net cost to the federal government.
The $559 million collected through those two categories of park receipts was less than 2% of the $29 billion visitors spent in surrounding communities over roughly the same period. The first figure covers fiscal year 2024; the second covers calendar year 2024.
Most of the money connected to park tourism reaches private businesses outside the parks.
The Economy Outside the Parks
The National Park System recorded 331.9 million recreation visits in 2024, including repeat visits and travel to historic sites, recreation areas, and other NPS-managed destinations.
Field Data / 2024
The Visitor Economy
National Park System · United States
Figures represent different economic and budget measures, not a net return on investment. Visitor-economy figures cover calendar year 2024; funding covers fiscal year 2024.
According to the agency's annual Visitor Spending Effects report, travelers spent an estimated $29 billion in gateway communities. Hotels and restaurants received much of that money, while other businesses benefited from transportation, recreation, and retail purchases. Spending continued through the economy as businesses paid employees and purchased supplies.
The NPS estimated the following national contributions for 2024:
Economic measure2024Visitor spending in gateway communities$29.0 billionTotal economic output$56.3 billionGDP contribution (value added)$33.7 billionLabor income$18.8 billionJobs supported340,100
Source: National Park Service, 2024 Visitor Spending Effects.
The $29 billion represents estimated purchases made by travelers. The $33.7 billion measures value added across the economy, including effects on suppliers and households, after intermediate purchases are accounted for. The larger $56.3 billion output figure includes transactions between businesses that aren't counted again in GDP.
The GDP contribution is about ten times the NPS's $3.325 billion regular appropriation. The comparison shows the scale of the visitor economy relative to federal funding, although it doesn't measure how much economic activity would disappear without the parks.
Yosemite, Yellowstone, and the Towns Around Them
At Yosemite National Park, visitors spent an estimated $629 million in surrounding communities during 2024, supporting approximately $476 million in local GDP contribution and more than 6,100 jobs. Yellowstone's corresponding figures were about $710 million in visitor spending, $544 million in GDP contribution, and more than 6,500 jobs.
In June 2022, heavy rain and rapid snowmelt destroyed sections of road and forced Yellowstone to close just as its summer tourism season began.
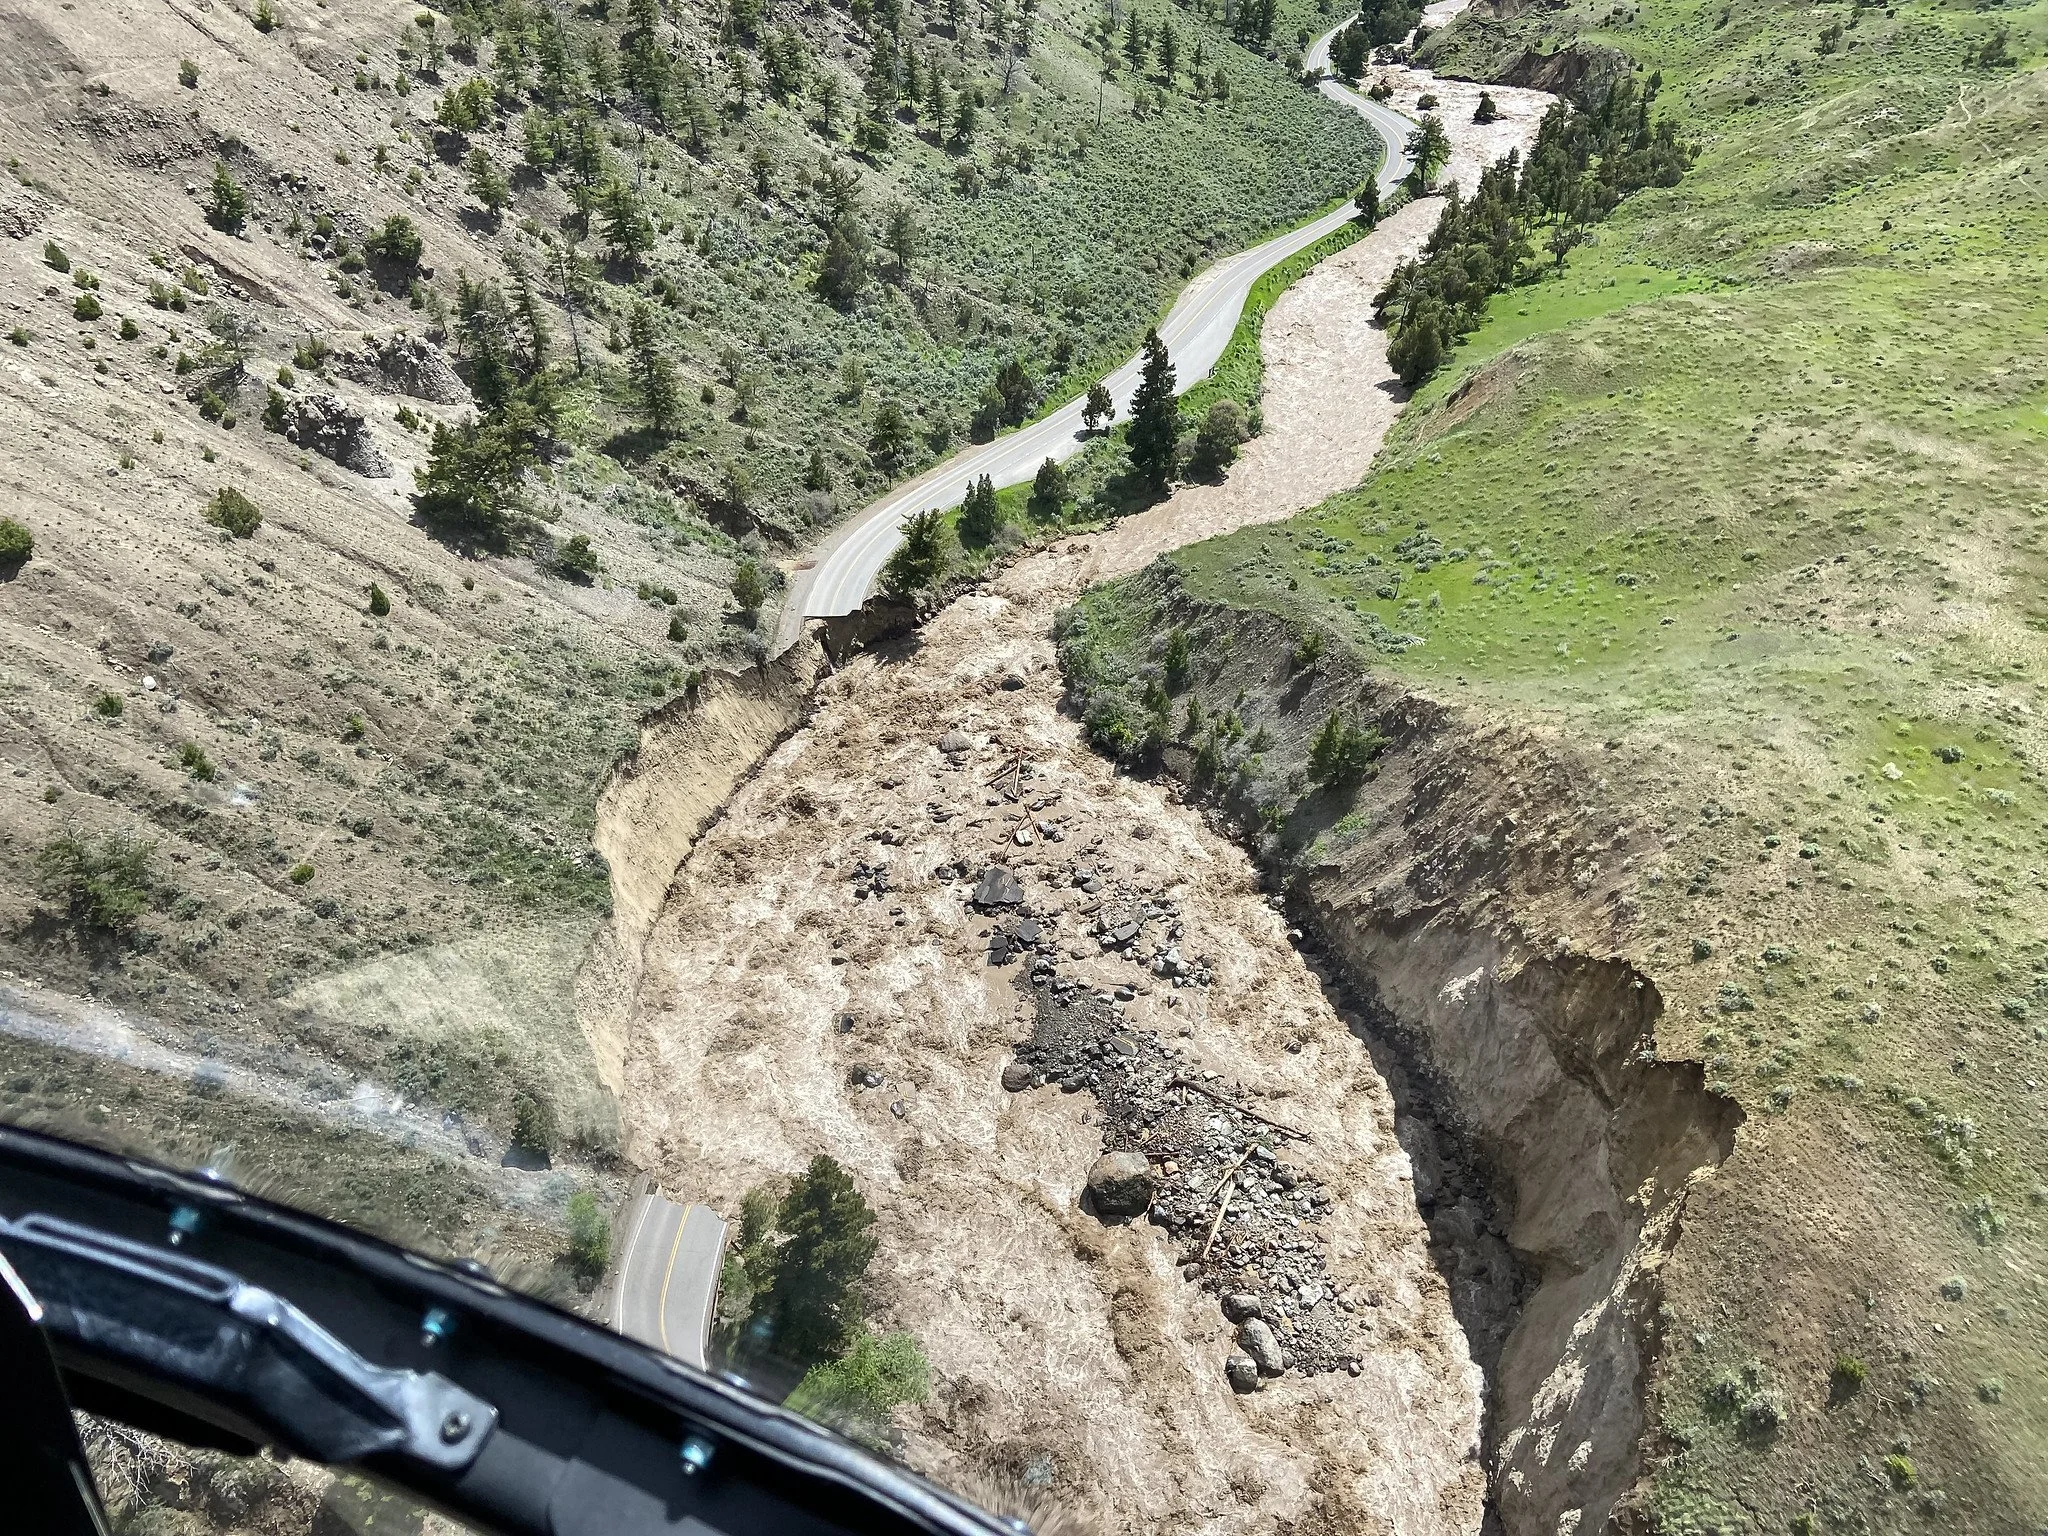
Flood damage to Yellowstone's North Entrance Road between Gardiner and Mammoth Hot Springs, June 13, 2022. Photograph by Doug Kraus / National Park Service.
The East, South, and West entrances reopened on June 22, with restrictions lifted in early July. The North Entrance at Gardiner and the Northeast Entrance serving Cooke City and Silver Gate remained closed to visitor vehicles through September.
The Federal Reserve Bank of Minneapolis held business roundtables in Gardiner and Red Lodge and surveyed businesses across southern Montana in the weeks following the flooding.
More than seven in ten Park County respondents expected their summer revenue to fall by at least half compared with the previous year. Some businesses voluntarily reported anticipated losses of 80%, 90%, or even 100%. These were expectations reported by participating businesses during an unfolding disruption, rather than audited year-end results or a representative estimate for every business in the county.
One Gardiner business owner reported closing two hotels and laying off employees after widespread cancellations. Other businesses described refund requests arriving just as the busiest months of the year should have begun.
Many tourism businesses in the region typically earned 60–80% of their annual revenue during the summer season, including September. The timing of the flood threatened the income they depended on for the rest of the year.
Most businesses weren't physically damaged enough to stop operating, the Fed found. What they lost was the visitors.
Yellowstone recorded 3.29 million recreation visits in 2022, down 32% from the record 4.86 million visits in 2021. Compared with 2019, when the park received 4.02 million visits, attendance was approximately 18% lower. The 2022 total includes nine days in June when the park was closed entirely.
The figures document a sharp decline in visitation, although they don't isolate the flood's effect from other factors.
According to the NPS flood recovery timeline, the Northeast Entrance reopened to regular vehicle traffic on October 15, followed by the North Entrance on October 30. The agency used a temporary route along the historic Old Gardiner Road to restore access from Gardiner. Repairs also restored the connection serving Cooke City and Silver Gate.
By then, the summer tourism season was effectively over.
The Federal Tax Question
The NPS estimates visitor spending, employment, labor income, and GDP contribution, but it doesn't publish a nationwide calculation of the federal taxes connected to those activities.
Workers pay income and payroll taxes, businesses may owe taxes on their profits, and some purchases are subject to federal excise taxes. Those collections enter the federal revenue system without being identified as national park tourism receipts.
A fiscal year 2024 study commissioned by Brand USA, the organization responsible for marketing the United States to international travelers, modeled the federal taxes generated by additional international travel attributed to its campaigns.
Tourism Economics estimated that this additional travel contributed approximately $6.55 billion to U.S. GDP and generated $918 million in federal taxes. The implied federal tax-to-GDP ratio is about 14%.
Applying that percentage to the $33.7 billion in GDP contribution connected to NPS visitation produces a figure of roughly $4.7 billion.
That would exceed the NPS's regular congressional appropriation by approximately $1.4 billion. But the calculation relies on assumptions that prevent us from treating the difference as a federal surplus.
The $3.325 billion appropriation is documented federal funding. The $4.7 billion tax figure is an extrapolation from a study of international tourism marketing, applied to an NPS visitor economy that includes a much larger domestic travel market. The populations may have different spending patterns, taxable earnings, and business profits. The appropriation also excludes some federal funding sources.
Some of the taxes connected to park tourism would still be collected if those travelers spent their money elsewhere in the United States. Depending on where they traveled and what they purchased, the federal government might collect more or less tax revenue. The NPS visitor-spending model doesn't estimate that difference.
The Tourism Economics calculation offers a rough illustration of the possible scale of tax collections connected to park tourism. It doesn't establish how much additional federal revenue the parks create, or whether that revenue covers their federal cost.
Spending, Employment, and Economic Benefit
Federal investments can provide economic value even when the agency responsible for them doesn't collect enough revenue to cover its budget. Public roads support commerce and employment without necessarily generating equivalent toll revenue. National parks have a similar financial structure: federal funding maintains destinations that attract travelers and support private businesses, while much of the resulting income reaches households and local communities.
A full economic assessment would also have to consider what alternative uses of federal funds might produce.
In a 2024 paper published in the Journal of Public Economics, economists Andrea Szabó and Gergely Ujhelyi examined the causal effects of establishing national parks on nearby communities.
They found that creating parks increased local employment and income. Their analysis indicates that visitors and the resulting economic effects helped drive those gains, which could not be explained by direct government spending on park budgets or by local substitution effects alone.
The employment gains diminished over time, while income effects proved more persistent.
The study challenges the idea that parks merely redirect spending between nearby communities. It doesn't establish that every dollar spent near a park represents additional economic activity for the country as a whole, nor does it tell us what would happen if Congress increased or reduced annual funding at an existing park.
International Visitors and the Money They Bring
Foreign visitors bring money into the United States from abroad, and national parks are among the places they visit.
The National Travel and Tourism Office's 2024 Survey of International Air Travelers found that 35.6% of overseas air travelers reported visiting a national park or monument during their trip. With approximately 35.2 million overseas arrivals, that represents about 12.5 million travelers.
Canadian and Mexican air travelers reported lower participation rates, at 20.9% and 25.7%, respectively. Applying those percentages to 9.7 million Canadian-air arrivals and 3.5 million Mexican-air arrivals brings the combined estimate to approximately 15.5 million international air travelers who reported visiting a national park or monument during their U.S. trip.
The survey includes monuments managed by agencies other than the NPS and doesn't capture many Canadian and Mexican visitors who enter the country by land. That omission matters for Canada, where road travel accounts for a large part of cross-border tourism.
It also records activities during a trip without determining whether a park was the main reason for visiting the United States.
The Congressional Research Service noted in February 2026 that the NPS does not systematically collect nationwide international visitor counts. The NTTO survey provides a broader view of international travel, but it cannot identify how many visitors chose the United States specifically because of its national parks.
That distinction matters economically. A traveler who comes from abroad to see Yosemite or Yellowstone may bring spending into the country that otherwise would have occurred elsewhere. The same cannot necessarily be said of an American traveler choosing between Yellowstone and another domestic destination.
The available international travel figures give us a sense of how widely the parks are visited. They also suggest that at least some of the economic activity surrounding them comes from money entering the United States rather than moving between domestic destinations.
A Value Beyond Visitor Spending
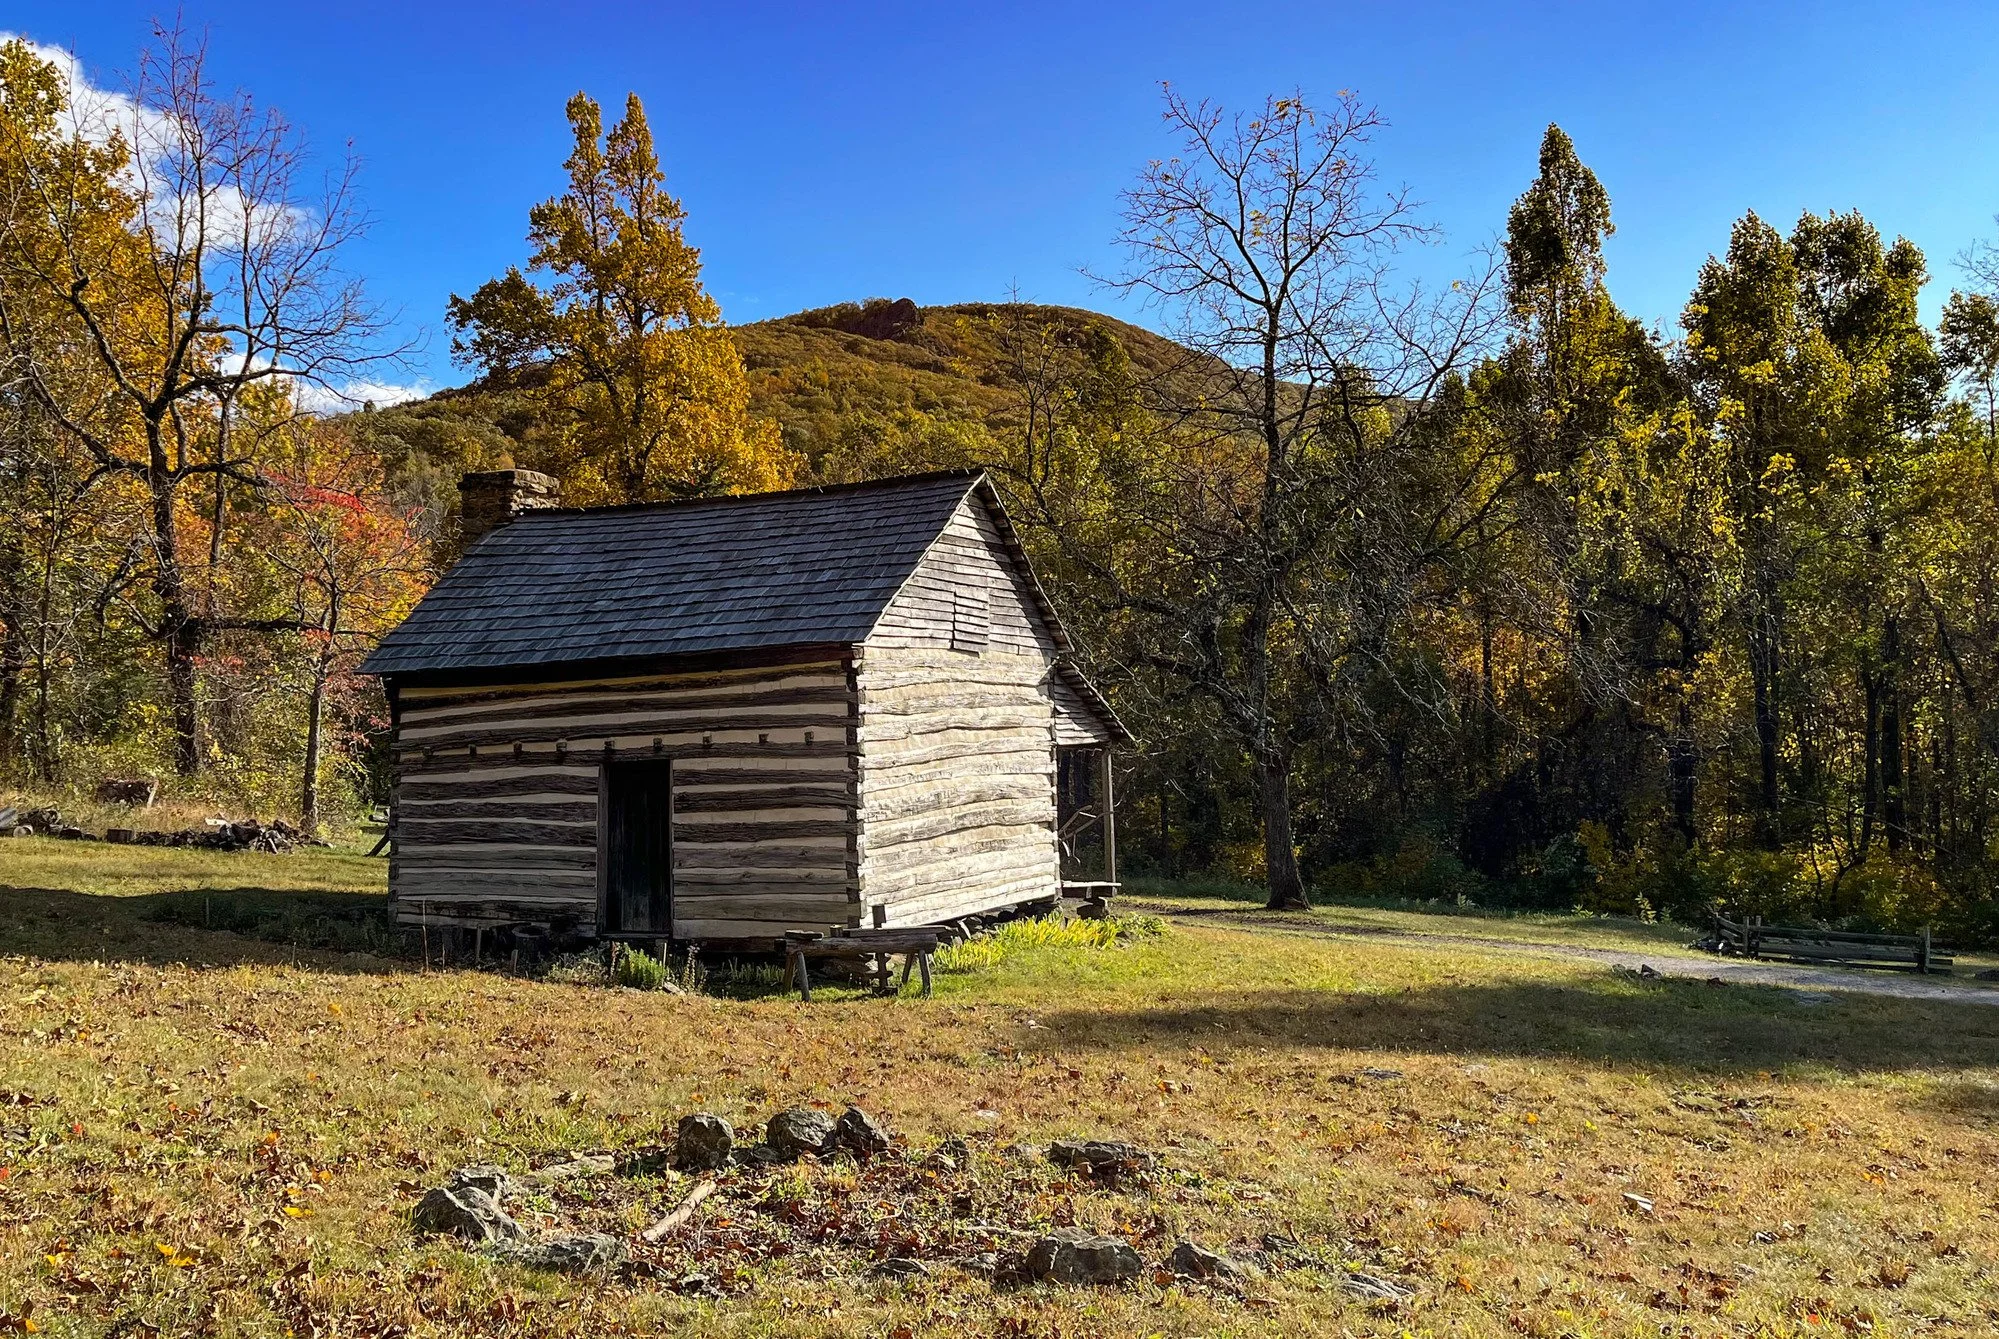
Historic farm at Humpback Rocks along the Blue Ridge Parkway, Virginia. Photograph by Victoria Stauffenberg / National Park Service.
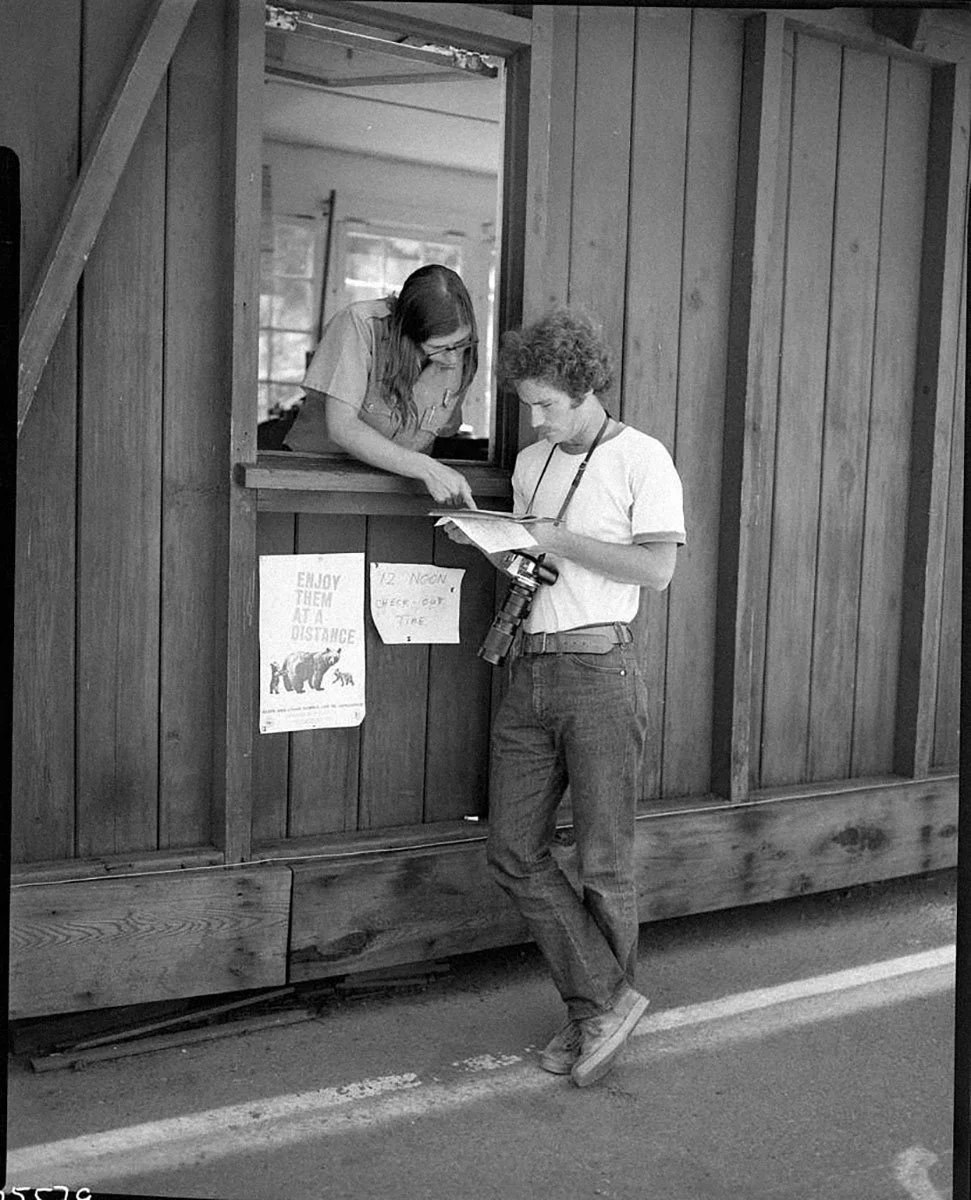
Marina D. Marelli, NPS park technician. NPS archival photograph.
In 2016, researchers Michelle Haefele, John Loomis, and Linda Bilmes published a study estimating the annual economic value of National Park Service lands and programs to the American public at approximately $92 billion.
The research, published through Harvard Kennedy School, assigned $62 billion to NPS lands, waters, and historic sites, with another $30 billion attributed to agency programs.
The study was conducted independently of the National Park Service, although its funders included the National Park Foundation, the agency's official nonprofit partner. The Foundation also announced the findings.
The researchers surveyed U.S. households about how much additional federal income tax they would be willing to pay each year, over a ten-year period, to prevent reductions in national parks and NPS programs. The questions presented different levels of cuts to protected lands, historic sites, and agency services.
The researchers used those responses to estimate the value of preserving the entire system. Their $92 billion annual estimate reflects that extrapolation, along with adjustments for differences between survey respondents and the broader population.
The calculation included non-use value: the benefit someone receives from knowing that protected places will remain available, even if they never visit them.
The $92 billion figure is a modeled valuation, rather than money collected or economic output generated by tourism. It cannot be added to the NPS visitor-spending figures.
The methodology deserves attention. Only about 18% of surveyed households responded, and respondents were somewhat more likely to have visited national parks than the general population. The researchers adjusted for differences in visitation and demographics. For their published $92 billion estimate, they also assigned zero value to the households that didn't respond.
Those decisions were intended to produce a conservative estimate, although they don't eliminate the uncertainties involved in using survey responses to assign monetary value to public assets. The extrapolation from partial reductions to the entire system introduces additional uncertainty.
Even with those limitations, the study addresses something conventional tourism statistics leave out: the value Americans place on preserving places they may never see.
What the Numbers Tell Us
The available evidence doesn't establish whether national park tourism generates enough additional federal tax revenue to cover the full cost of the National Park System. The tax illustration suggests that the amounts involved could be significant, but it isn't a substitute for a study designed to answer that question.
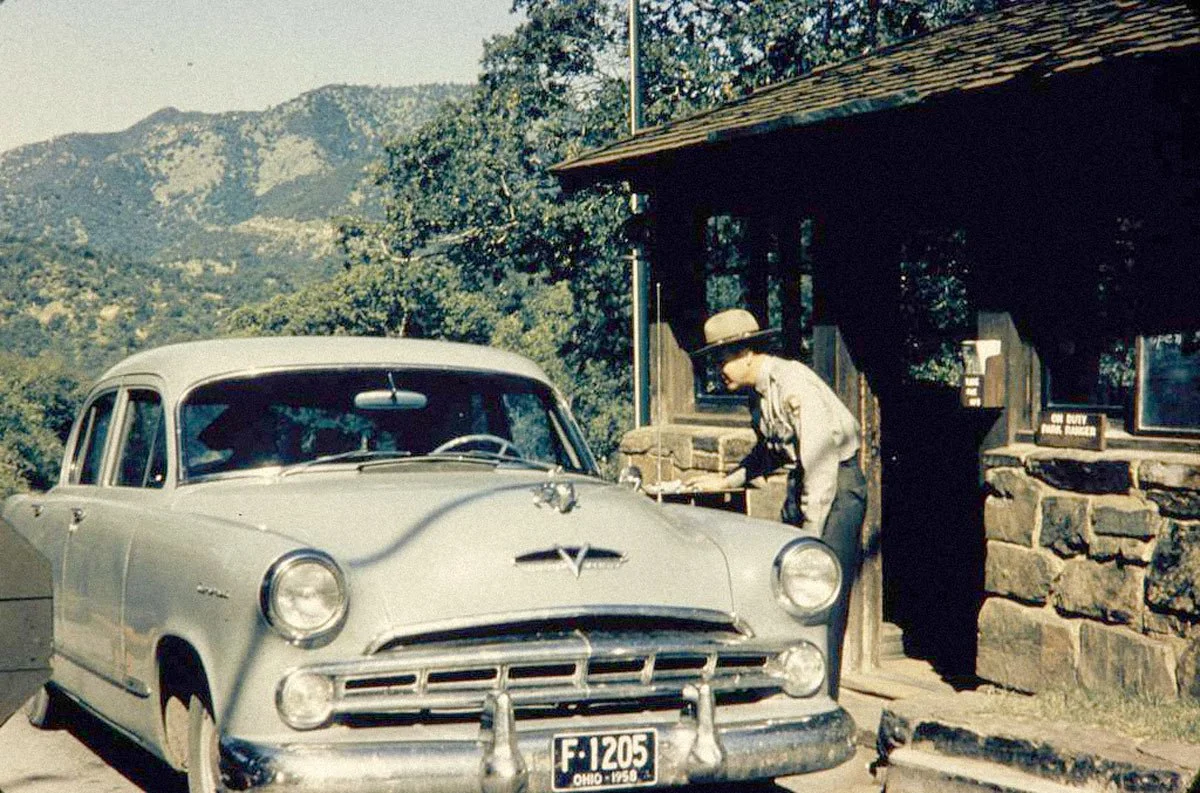
A park ranger speaks with a visitor at a national park entrance station. National Park Service History Collection.
What we can establish is the scale of the economy connected to national park visitation.
In 2024, NPS visitation was associated with $29 billion in spending around the parks, $33.7 billion in GDP contribution, and approximately 340,100 jobs. Those are modeled economic contributions, rather than a measure of what would disappear if the parks ceased to exist.
Other research provides evidence that parks help create economic benefits, rather than merely serving as destinations for spending that would have occurred anyway. Studies of park establishment have found positive effects on nearby employment and income, while survey-based valuation research suggests that Americans place monetary value on preservation itself.
The strength and meaning of that evidence vary. We have a detailed picture of the visitor economy, less certainty about the additional federal tax revenue it creates, and a separate body of research attempting to value the benefits of protecting the parks.
A closer examination of those questions would improve the financial debate. The NPS could work with independent economists to estimate the federal taxes connected to park tourism and how much of that revenue depends on the parks themselves. International visitation deserves particular attention, given the potential contribution of spending brought into the country from abroad.
We didn't begin this research expecting to put a price on the national parks. We wanted to understand what the federal government spends to maintain them and how much economic value they help create.
Decisions about the future of public lands also involve opportunities for public input. When federal agencies propose changes to land management, members of the public can often submit comments during designated review periods. We've put together a guide to commenting on public lands explaining how that process works and how to participate.
We believe these places deserve protection regardless of what the financial calculations produce. But when their funding is debated, the public deserves to know what the country receives in return.

Sources & Methodology
This article compares fiscal year 2024 federal appropriations and receipts with calendar year 2024 NPS visitor-spending estimates. Figures are rounded for readability. The different reporting periods and economic concepts are identified where relevant.
National Park Service — 2024 Visitor Spending Effects
Flyr, M., E. Stockmoe, C. Cullinane Thomas, L. Koontz, and C. Huber (2025). 2024 National Park Visitor Spending Effects: Economic Contributions to Local Communities, States, and the Nation. NPS Science Report NPS/SR—2025/353.
Primary source for visitor spending, GDP contribution, labor income, employment, and park-level economic estimates.
National Park Service — Visitation Statistics
Official NPS statistical reporting for recreation visits and National Park System units.
Congressional Research Service — National Park Service: FY2024 Appropriations
CRS report IF12436. Regular appropriations and operations funding.
National Park Service — Deferred Maintenance and Repairs
FY2024 estimate of $22.988 billion.
https://www.nps.gov/subjects/infrastructure/deferred-maintenance.htm
Office of Management and Budget — FY2026 Budget Appendix
National Park Service accounts, including FY2024 actual recreation-enhancement and concession franchise-fee receipts.
https://www.govinfo.gov/content/pkg/BUDGET-2026-APP/pdf/BUDGET-2026-APP-2-13.pdf
Federal Lands Recreation Enhancement Act — 16 U.S.C. §6806
Statutory provisions governing recreation-fee receipts and site-level retention.
https://uscode.house.gov/view.xhtml?req=(title:16%20section:6806%20edition:prelim)
Federal Reserve Bank of Minneapolis — Montana's Silent Yellowstone Flood: When Tourists Leave
Ron Wirtz, 2022. Business roundtables, regional survey responses, and reporting on the effects of the Yellowstone flooding.
https://www.minneapolisfed.org/article/2022/montanas-silent-yellowstone-flood-when-tourists-leave
National Park Service — Yellowstone Visitation Summary for 2022
Annual visitation totals, entrance closures, and reopening dates.
National Park Service — Yellowstone Flood Recovery & Operations
Timeline of road repairs and restoration of vehicle access.
Tourism Economics / Brand USA — FY2024 Return on Investment Study
Source for the modeled $6.55 billion GDP contribution and $918 million federal tax estimate associated with additional international tourism attributed to Brand USA marketing.
https://pop.ustravel.org/wp-content/uploads/2025/10/Brand-USA-FY24-ROI-Tourism-Economics.pdf
National Travel and Tourism Office — 2024 Survey of International Air Travelers
International air-arrival totals and national park/monument participation rates.
https://www.trade.gov/feature-article/survey-international-air-travelers-results-2024
Congressional Research Service — International Visitor Fee Research
CRS report IF13098, February 3, 2026.
Szabó, Andrea, and Gergely Ujhelyi — National Parks and Economic Development
Journal of Public Economics, Volume 232 (2024), Article 105073.
Haefele, Michelle, John Loomis, and Linda J. Bilmes — Total Economic Valuation of the National Park Service Lands and Programs
Harvard Kennedy School Faculty Research Working Paper RWP16-024, June 2016.
Full study, Harvard Environmental Economics Program:
National Park Foundation — Announcement of the $92 Billion Valuation Study
June 30, 2016. Announcement of the independently conducted study. The Foundation was among its funders.
Methodological Notes
Federal funding: The $3.325 billion figure represents regular FY2024 discretionary appropriations. It excludes some mandatory and extraordinary funding and is not a complete measure of federal expenditures attributable to the National Park System.
Economic contributions: NPS visitor-spending estimates are modeled economic contributions connected to visitation. They do not measure the net economic activity that would disappear without the parks.
Federal taxes: The approximately $4.7 billion figure applies the federal tax-to-GDP ratio from the Tourism Economics/Brand USA study to the NPS's $33.7 billion GDP contribution. The calculation has not been validated for the NPS visitor economy and is not evidence of a federal fiscal surplus.
International visitors: The approximately 15.5 million estimate uses rounded 2024 NTTO figures: 35.2 million overseas air arrivals × 35.6%; 9.7 million Canadian-air arrivals × 20.9%; and 3.5 million Mexican-air arrivals × 25.7%. It includes some monuments outside NPS management and excludes many land-border arrivals.
Non-market valuation: The $92 billion estimate comes from a 2016 Harvard working paper. It represents modeled annual willingness-to-pay benefits, including non-use value, based on the study's survey and valuation methods. It cannot be added to visitor spending, GDP contribution, or federal tax revenue.